Recentely my electricity and gas meters were replaced with smart meters. I already had an energy monitoring system in place (originaly a openenergymonitor system but later modified to put data into grafana rather than their emoncms software). But with the new meters installed I wondered if their smart functionality would allow me to gather any additional or more accurate information from them and add this to my monitoring setup.
After some investigation I was able to get a range of data from the smartview 3 display that came with the smart meters and integrate this into my graphing system. I have created a python progam which decodes the data it tramnsmits and provides it as a set of prometheus metrics that can be collected by my monitoring system. This can be found on github along with instructions on how to use it and a version packaged as a docker container. The rest of this blog post details the process I went through to extract the data and add it to my graphing system and may be of use to others atempting similar things.
Initial investigations
While I was aware there were commercial solutions that would provide access to smart meter data. I noticed the smart meter came with a display module that had a USB connector for its power supply which looked like a potential route for geting data without needing to get a new display which also allows access to the data, but it also could have just been for power.
My first step was to do some research to see if anyone else had managed to get any useful data from the port. My searching turned up two forum posts on the homeasistant forums (here and here) for the previous model of the display which noted that there was a serial ouptut via the USB port (not a usb to serial connection just serial on one of the USB data pins). The authors of those posts had managed to make some progress in decoding the data emitted by their units, however, they reported some issues such as incorrect values being captured. Therefore some more work would be required to resolve those issues only if I could get the same data from my unit.
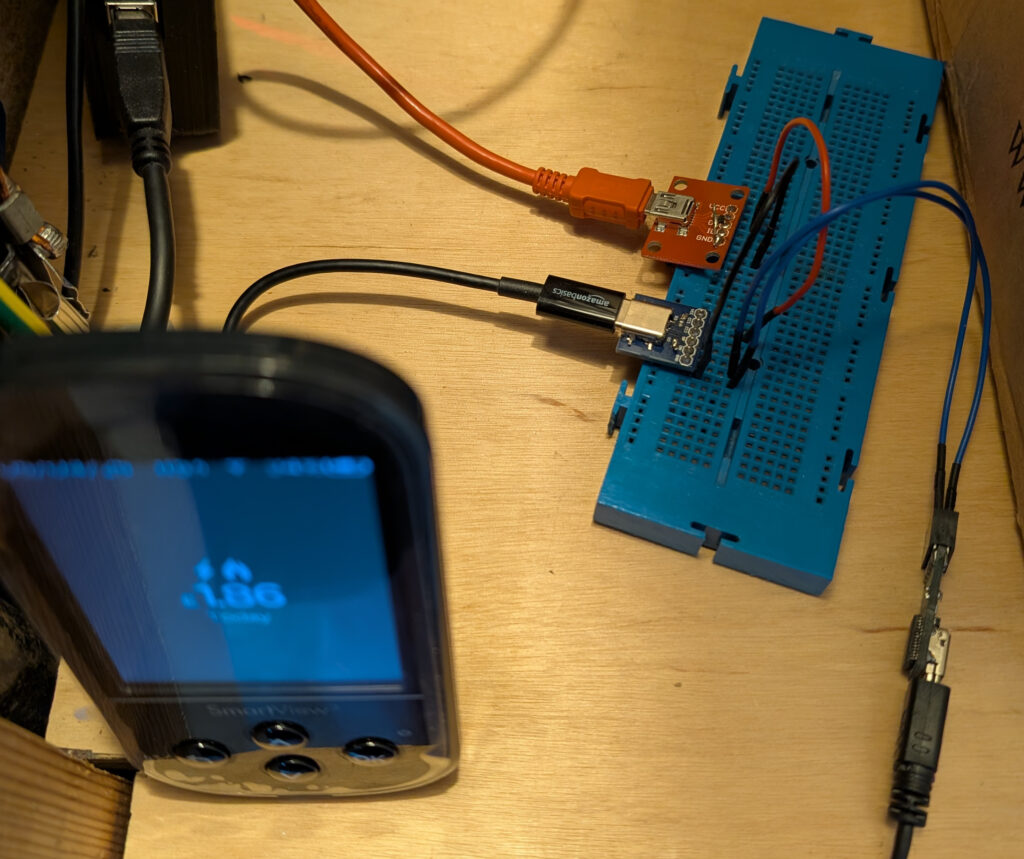
As the forum threads were on a previous model of the display unit there was no gaurantee that the newer unit would have the same output, this would be the first thing to test. Therefore to test this I connected the unit to a USB breakout board I had and connected the data pins to a logic analyser to capture the output. The analyser showed that serial data was always being sent out by the display on the USB D- data pin, so things were looking good so far.
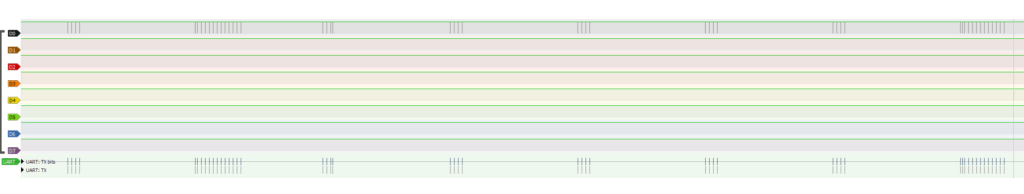
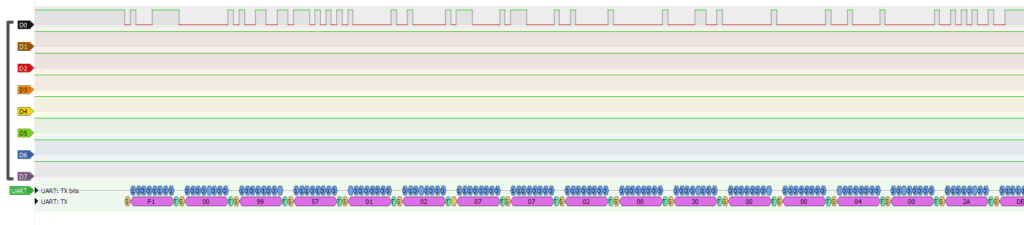
I captured a small number of packets from the logic analyser and compared them against the information provided in the blog posts, there were a lot of similarities but also some differences so some things had clearly changed in the newer model. In addition there was still the issues with incorect values in the data that they had reported to investigate.
data packet observed
00 99 57 01 02 07 00 00 00 25 f6 57 00 00 00 00 14 00 00 30 02 00 02 00 18 00

data packet reported in the forum post
04 01 02 07 00 00 00 25 03 BD 68 00 00 00 01 04 00 22 C3 0D 00 14 00 00 30 02 00 02 00 18 00
Investigating further
My next step was to record some data that I could use for doing further analysis without needing to do it in realtime. To achieve this I wrote a quick python script that would dump the data recieved from the serial port to a set of hex data in a file. I connected up the usb breakout setup to a usb-serial converter and another USB power supply to keep the display powered. I left this running for a day or so which provided a good block of data to work on.
Once I had the data I wrote some more python scripts to start splitting out the data and to try and evaluate further. Using the information from the forum posts and the logic analyser data I was able to split the stream into a combination of text strings which I presume are debug strings and data blocks which are delimited by F1 and F2 markers. I had a look through the text strings and as menitoend in the forum posts they did not look to contain any useful measurement data, however the text in the string does look to be related to the zigbee network as one of the numbers matches the parent address in the radio info menu on the display. Based on the timing information from the logic analyser my hunch is that the human readable strings are a debug message sent at the start of a process and the data blocks are the result of the process, possibly a dump of the data recieved by the display.
As an intial test I tried filtering packets by starting byte sequences to try and indentify how many types of messages were present in the information and if i could get them to match up with the examples in the forum post. I was able to identify various sequences that had a level of commonality with those in the forum post and could extract values for some data fields they had identifed. While doing this I noticed that there were no appearances of the F1 and F2 values outside of the start and end of the data packets, given the length of the recording and that the values are direct integers I would have expected to have seen them in the data. This indicated that there was likley an aditional level of encoding which removes such data from the data blocks and understanding this would be important to decode the data correctly.
To check this I looked for a set of packets that had an increasing counter such that I could see what happened when it reached the F1 and F2 values. I was able to find a set of packets containing a meter reading using my inital exploration of common prefixes that showed this behavior. From those packets I was able to observe one of the bytes in the reading going through the following sequence as it increased with the data block getting longer when it reached the relevent section.
ef
f3 00
f3 01
f3 02
f3 03
f4
This confirmed the suspicion that there was an additional encoding step which was replacing the F1 and F2 values but also encoded F0 and F3 values as well. My evaluation script could then be extended to decode this encoding by replacing occurances of F3 and its following value with the correct values. If this encoding is present in the previous version it is likley that this was the cause for the decoding errors reported in the original blog posts. With this information and that in the blog posts I was able to pull out the values they had identified and generate some simple graphs that looked like they were correct.
While I could have written a decoder based on this, that would publish some useful values, some items in the data hadn’t been decoded by the forum posts so I wanted to see if they could be understood.
Completing the decoding
Looking at the set of data avaliable, the encoding seemed to be more complicated than would be required for just debugging purposes. Based on this I had a hunch that this was likley a dump of data being recieved by the display. To investigate this I searched online for smart meter protocols and discovered a zigbee specification for energy monitoring that looked to be used in smart meters.
With this information I attempted to decode a couple of the packets manualy to see if I could apply this information to them. My starting point was to try and search some of the byte sequences in the packet in the specification document to see if I caould locate them. The diferences between different types of packets provided clues as to which items of the packets were worth searching. This started to fill in some values and allowed guesses for what other items may be. However various information appeared to be missing in this specification such as what the parameter encoding types were. My inital attempt was to make guesses as to what they were (or at least how long they were) as it was possible to locate the identifier for the next paramerter.
Using this information I wrote a program that could attempt to decode the packets and highlight any which it was unable to decode so they could be investigated and the process repeated. This highlited two key items, that the first byte of the data blocks seemed to indicate a type as only those starting with a 00 byte matched with this specification. The other was that some of the packets had a timing cluster ID that was listed in the above specification but without details, this indicates there is another document that conatins the missing details. More searching revealed the main zigbee cluster specification which included details of the timing cluster and also the avalaible encoding formats I was guessing at previously.
With this information in hand I was able to complete decoding of the recieved packets starting with 0x00. There were still some unknowns but these did not seem to be a blocker for making use of the information
I have shown an example of a decoded packet below
Original packet
00 99 57 01 02 07 00 00 00 25 f6 57 00 00 00 00 14 00 00 30 02 00 02 00 18 00

Decoding

# header
00 # unknown but looks to be a packet type as other values here do not decode using the zigbee format
99 57 # unknown but is different for each meter so can use as a meter reference
01 # unknown this was constant for one meter but the other meter has several values but all decode correctly
02 07 # cluster ID (metering)
# first parameter
00 00 # parameter ID (meter reading)
00 25 # parameter format (unsignned 48 bit integer)
f6 57 00 00 00 00 # parameter data
# second parameter
14 00 # parameter ID (supply status)
00 30 # parameter format (8 bit enum)
02 # parmeter data
# third parameter
00 02 # parameter ID (meter status)
00 18 # parameter format (8 bit bitmap)
00 # parmeter data
With the packets decoded I created a script to list all the cluster IDs and parmeter IDs seen in the captured data and to print those out. This revealed a list of all the data I could get from the display and how many times the information has been seen. Some items had only been seen a few times so were likley caused by me interacting with the display during the packet capture. To correct for this I performed another set of recordings but deliberatley didnt interact with the unit during this time as to only capture information sent out constantly. Re-running the scipt on this new data provided the list of avalible metrics that I could use.
Putting everything together
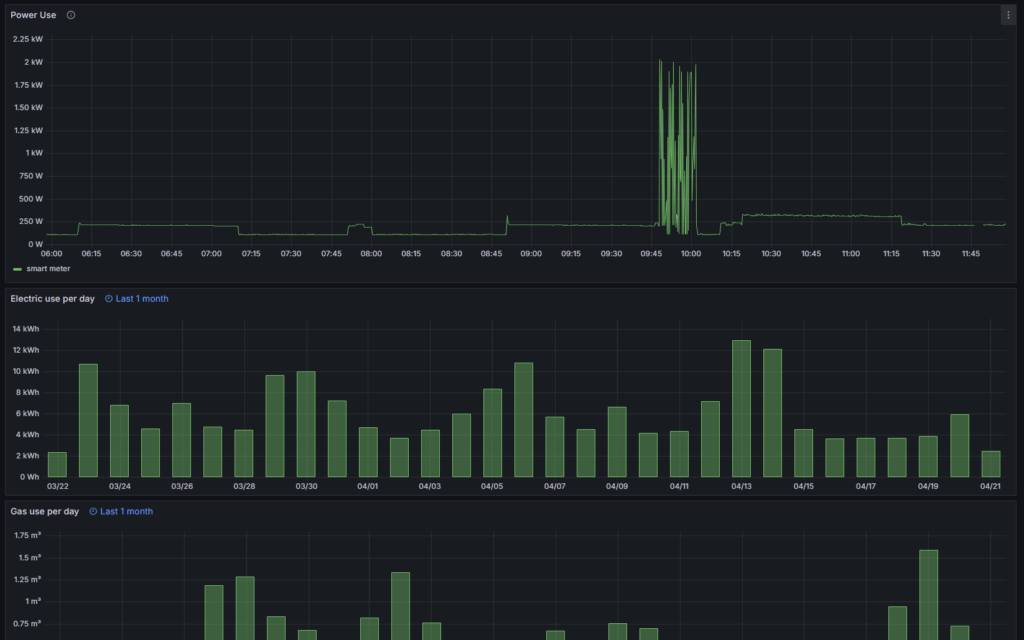
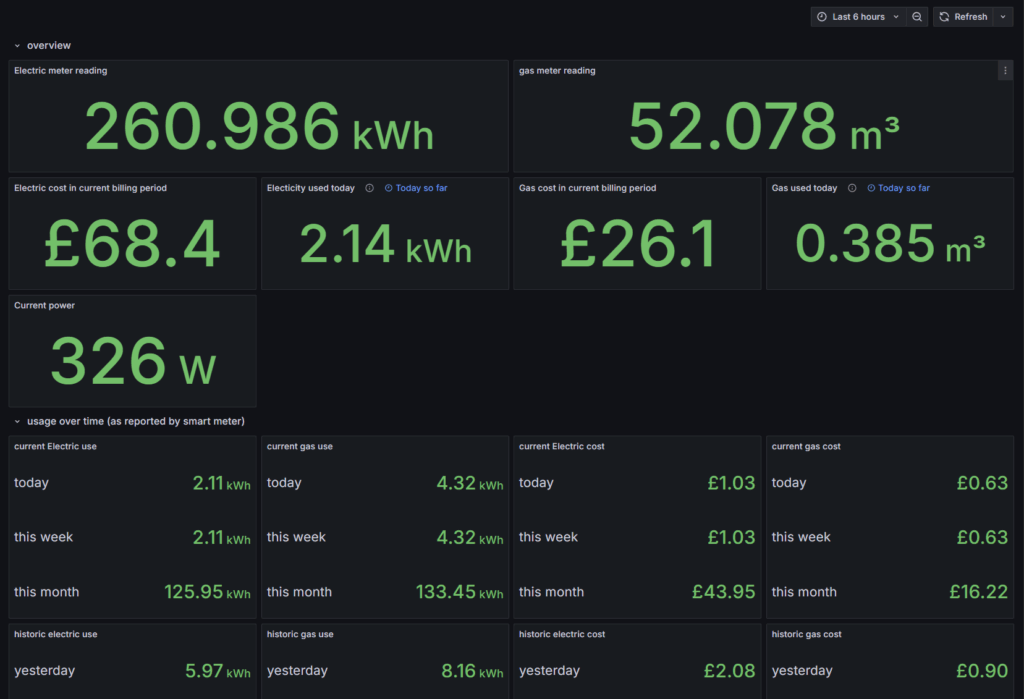
With the information formatting understood, the remaining steps of the project were to turn this knowledge into a program that could take the data and provide it to my other systems. I was able to reuse the decoding components I wrote in the previous section and wrap them into a python program that recieves the serial data and provides a metrics endpoint that can be collected by the prometheus monitoring systems. This was then packaged into a Docker container and deployed with the rest of my docker containers. I then use grafana to present this data as a series of graphs and values. The results of this can be found on the projects github page.
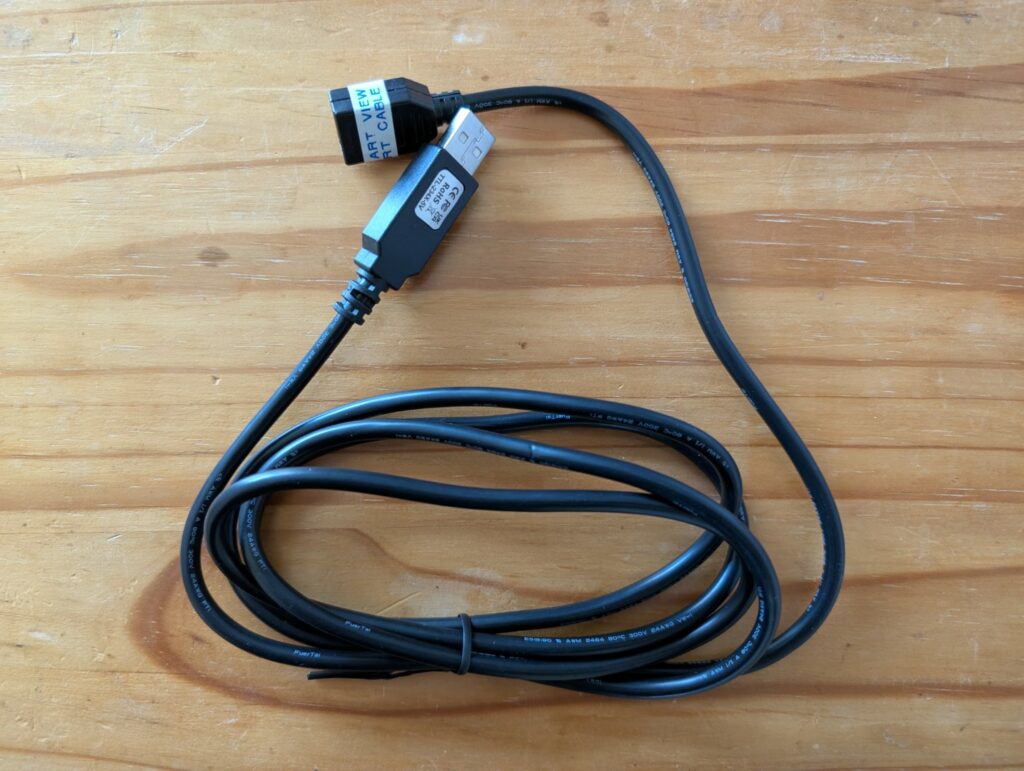
The last step was to create a cable that could replace the breadboard and breakouts that had been used so far with somthing suitable for long term deployment. The display requires a small USB connector, so using a rewirable micro connector was not an option. Instead I used a standard micro USB cable and added a female USB connector to the FTDI usb-serial cable. Details on creatint this are also in projects Github readme.
With the new cable connected and the software deployed I am able to make use of a range of values from the smart meter. Hopefully detailing the steps I went through to achieve this will help others in similar activities.